R18.1 Black Widow is now live – introducing a significantly enhanced user interface for one of Predatar’s most-used features… And this is just the beginning!
The headline news in our last major release, R18 Black Widow, was support for Zerto workloads. This means that Zerto customers can benefit from Predatar’s unique Recovery Assurance capabilities. But that’s only part of the Black Widow story.
Behind the scenes, our development team laid the groundwork in R18.0 for a big evolution of the Predatar GUI (Graphic User Interface).
As Predatar CEO, Rick Norgate explains: “Over the coming months, Predatar users will see an exciting evolution of the platform. Moving forward, Predatar will not only look more modern and polished, but – importantly – it will become more intuitive and easier to use.”
While there’s no doubt the new direction for the GUI looks great, the changes are far more than cosmetic. At their core is a UX/UI framework designed to make Predatar more intuitive and boost productivity for users.
For Predatar customers the journey begins today, with the launch of R18.1 Black Widow. This new release includes a dramatically enhanced Data Explorer interface. Not only will users notice the impactful new look – setting the tone for future GUI enhancements – they’ll also find that Data Explorer is simpler, clearer, and more efficient to use.
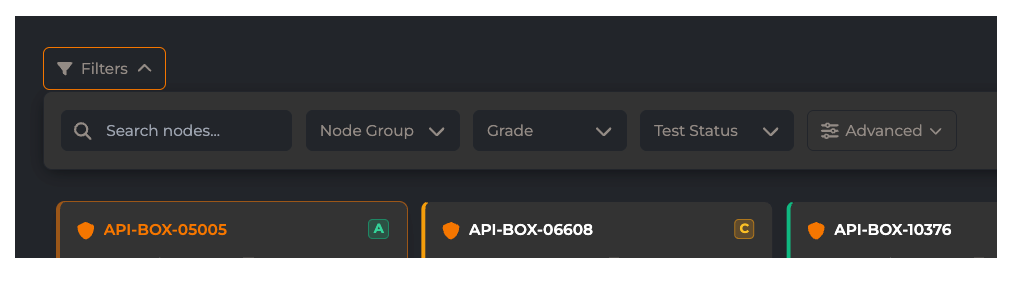
Filter Faster.
Feedback from customers told us that the filters and display options in Data Explorer felt overwhelming. Backend analytics supported this – showing that roughly half of the available options were rarely, if ever, used.
Previously, there were more than 20 ways to filter data and 4 different ways to visualise the results. We’ve reduced the options by around 50%. Now, there is a more streamlined control panel highlighting just three filters that our users utilise time and time again, with a further 7 ‘advanced’ filters just a click away. The ones that no one was using? They’ve gone!
We’ve also removed the ‘scatter’ and ‘graph’ view options. While they were cool features, they simply weren’t adding practical value – so they’ve gone too. By focusing on the tools our users actually rely on, we’ve decluttered the interface, making it easier and faster to get to the answers you need. It’s also created more space for the data ’tiles’ themselves. And those have been enhanced too…
More insights. Fewer Clicks.
Users will immediately notice the evolution of the Data Explorer tiles. They now surface far more of the information you need — without requiring multiple clicks. Previously, users would regularly have to drill into individual nodes to get important information. Now, essential detail are visible at a glance, including backup platform, workload type, storage size, and resilience fundamentals, and anomaly count.
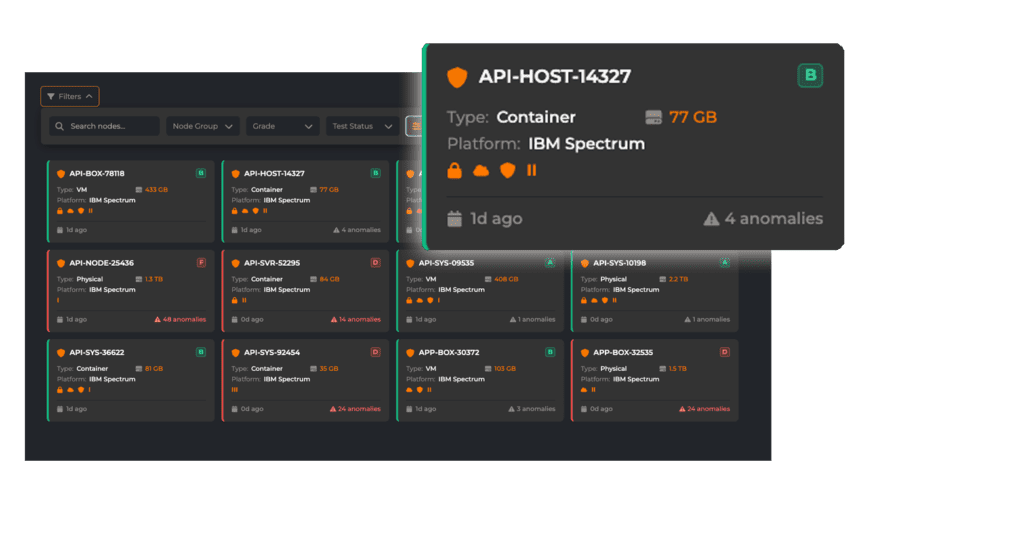
The result? Clearer analysis. Reduced friction. Faster decision-making.
Accessibility Matters.
Improving accessibility is a key objective in the evolution of the Predatar GUI. Data Explorer, with its need to communicate dense information in a compact space, presented a particular challenge.
The previous interface relied heavily on colour — using a traffic light system to indicate node health. While effective for many users, this approach could create barriers, particularly for those with colour vision deficiencies.
The new design still uses a traffic light model, but colour is no longer the primary signal. Health grades, anomaly counts, and recovery indicators are now clearly displayed as text and structured data — ensuring users can understand node status without relying solely on colour.
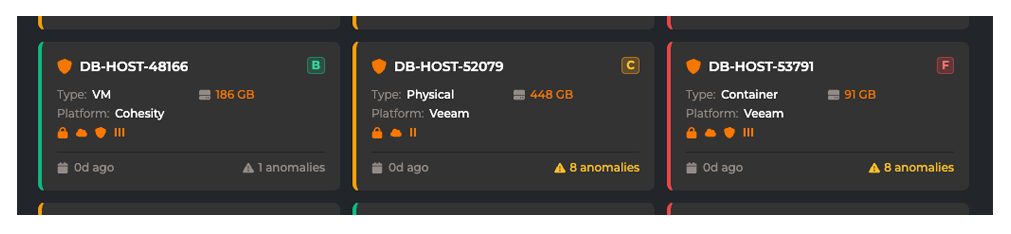
In addition, Predatar continues to offer both dark and light display modes, so you can choose the right visual settings for you and your environment.
Accessibility isn’t an afterthought — it’s becoming foundational to the Predatar experience.
What’s next?
This is just the start. The Predatar team will continue to enhance the user experience. With each update, the platform will become more powerful, more intuitive and easier to navigate.
To be among the first to hear about upcoming releases. Follow Predatar on LinkedIn, or join our mailing list for updates delivered straight to your inbox.
